Weather
Weather plays a critical role in simulation accuracy, particularly for offshore wind projects. It directly influences key operational parameters such as:
-
Installation duration: Adverse weather can delay activities like jack-up operations or heavy lifts.
-
Asset accessibility: Weather windows determine when tasks can safely and effectively be carried out offshore.
Failing to model realistic weather conditions lead to optimistic projections and inadequate risk assessments — especially during the construction and O&M phases.
The four ways to use weather in a simulation
When configuring your simulation, you can choose from four weather modeling options: Disabled, Historical, Increment Start Year, and Markov.
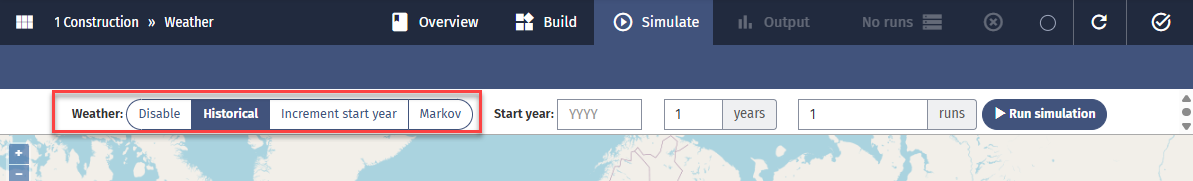 The option you select to run your simulation on will determine the output you get. We will now explain these options.
1. Disabled
No weather restrictions are considered in the simulation runs.
Use case: Best suited for testing task logic, troubleshooting issues with the weather file, or isolating specific model behaviors without external constraints.
2. Historical
Uses the first year of your weather file for all simulation runs as the starting point in the weather file. The simulator looks at the weather data corresponding to the start date of your simulation case. For example, if you added weather data from 01.01.1980–31.12.2016, and your simulation case starts from Jan 1 of year 1, this corresponds to 1.1.1980 in the weather data.
Use case: When you want to look at variability in the simulation results with the same weather pattern in all simulations, e.g. when you want to look at how much variability comes from the corrective failures in O&M.
Note: For construction simulations that don't have stochastic tasks you will get the same results for every simulation run when you use the Historic option.
3. Increment start year
Each simulation run begins with a different year from your weather file, starting sequentially from the first year.
Run 1: starts the weather data from year 1 in your weather files (simulation year 1 - weather year 1).
Run 2: starts the weather data from year 2, and so on (simulation year 1 - weather year 2).
If the number of runs exceeds the number of years available from the weather file, the simulation will loop back to the first year in the dataset.
Use Case: Recommended for generating outputs including a wider range of weather scenarios, which means your schedules and weather downtime assessments are more robust. This is the recommended method for construction simulations.
Note: For construction cases set the number of runs to the number of weather years you have in the weather file, as the runs will give the same results for the same weather data when the weather data loops and will clutter your outputs.
4. Markov
Utilizes our Markov chain model to generate synthetic weather data based on the weather data set provided.
Use case: Beneficial when you want to run more iterations than you have years in your weather data set. For example when your weather set have a few years only.
Note: For a Markov weather model to work, you need to add a 'Month' column when uploading your weather file.
A Markov model calculates the probability of going from a given weather state (e.g., 1.5 m wave height and 10 m/s wind) to all other weather states that have appeared after that one in your weather dataset. Based on these probabilities, the model can generate a new string of weather states by drawing randomly generated numbers between 0 and 1 for each new state and picking the next state with the closest probability.
Creating synthetic weather data time series in this way is useful when your weather data time series is incomplete, you want to do longer simulation runs than years in the imported weather data time series, or you’re going to run a very large number of simulations.
The accuracy of the newly generated time series improves with the amount of raw import data.
How Shoreline uses weather in a simulation run
Shoreline simulates sequences and timings of operations through time. This is why our apps require weather input in the time domain instead of statistical input such as e.g., weather windows or weather downtime.
Weather data time series consist of one or more weather parameters, e.g., significant wave height and wind speed (required parameters in Shoreline) and a timestamp. In Shoreline, you can use any weather parameter for which you have time series data available.
Based on these time series, it is possible to generate weather window statistics and traditional weather downtime statistics.
To understand how Shoreline does this, the following definitions are useful:
-
Weather state: One or more weather parameters taken together, e.g., 'wind speed' and 'wave height'.
-
Weather window statistics: A histogram of weather window lengths for a specified weather state.
-
Shoreline calculates the weather distribution from one data point to another data point (so from one hour to the next hour) using the "linear distribution".
When generating weather window statistics, the weather windows for a weather state with 1 hour, 2 hours, 3 hours, … 30 hours, etc. lengths in a weather data time series are identified.
The weather window algorithm uses the weather data time series to check if the weather criteria set on an activity are met for the required weather window length.
Example
Shoreline Design case: 100 WTG installations.
For all 100 wind turbine installations, an HLV will go through a work process to assemble the constituent parts. This work process has three steps:
- Lift the tower in place.
- Duration: 7 hours
- Required weather window: 9 hours
- Wind speed: 14 m/s
- Wind speed reference height: 100 m.
- Lift the nacelle in place.
- Duration: 7 hours
- Required weather window: 9 hours
- Wind speed: 14 m/s
- Wind speed reference height: 100 m.
- Attach the three blades.
- Duration: 7 hours
- Required weather window: 9 hours
- Wind speed: 12 m/s
- Wind speed reference height: 100 m.
Before each step beings, the weather-checking algorithm runs to verify whether there is a suitable weather window.
For step 1, if the wind speed is less than 14 meters per second at a 100-meter height for the next 9 hours, the activity can start.
When step 1 is complete, a new weather window check for the nacelle installation starts. For this, a weather window of 9 hours with a wind speed below 14 m/s at 100-meter height is necessary.
Following completion of step 2, the same weather window for the blade installation but with a lower wind speed limitation (12 m/s) is required.
Any delay in step 1 can cause a knock-on delay to step 2 due to missing a weather window. This is called a negative feedback loop in simulation theory. This interdependence between operations and vessels is not easily calculated with the statistical approach.
Estimating weather downtime through a simulation is more accurate as it includes the variability of weather in a month and does not assume it is constant like the traditional weather window statistics approach.
Estimating project plans
Weather is the main source of uncertainty in offshore construction projects and maintenance activities.
A weather downtime assessment provides input for a project plan estimation.
There are two approaches to master schedule estimation:
- The traditional approach:
- Use weather window statistics.
- Estimate weather downtime for different operations per month and multiply this workability percentile by the corresponding operation’s duration to get the weather-adjusted duration.
- Shoreline’s simulation modelling:
- Use modeling software to estimate a probability weighted master schedule, accounting for the variability of weather within a month, in addition to estimating the weather downtime per month.
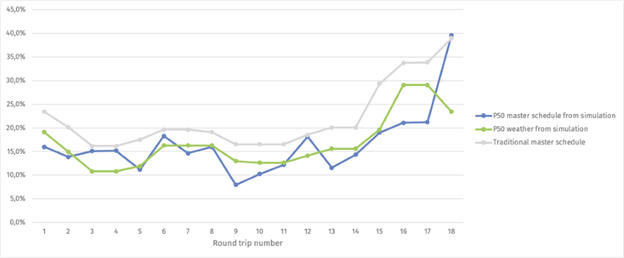
Running simulations with Shoreline Design estimates a master schedule and weather downtime, including weather variability within a month and the interdependence of all the operations. The traditional approach has a smooth curve because no variability in weather the whole month is assumed. The chart below shows the difference between weather downtime estimated traditionally (orange) and with simulation (blue).
Where can I add weather data and set weather restrictions?
You can set weather in 2 places:
- On assets
- On bases
You can set weather restrictions in 3 places within Shoreline:
- WTG operational criteria
- Determines when a WTG stops producing power.
- Logistic access criteria (SOV, CTV, helicopter)
- Determines when a logistic can access an asset to unload or pick up crew.
- Logistic processes (HLV, CIV, TV, Crane, AHV, CoTV)
- Determines when a logistic can carry out part of its work process, e.g., when an HLV can jack up.