Output dashboard
The output tab of your cases displays graphs of simulation data and provides output report and project plan downloads.
This page details the key functionality of the output tab.
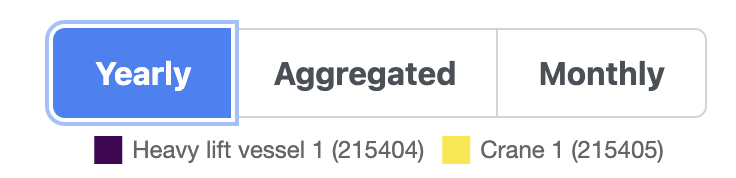
Statistical and run-specific outputs
Statistical outputs pull data from across all the simulation runs for display, while Run-specific outputs come from a single p run.
All values on both tabs are displayed for the p value you select.
You can learn all about percentile values, p runs, and how they work on our percentile values page.
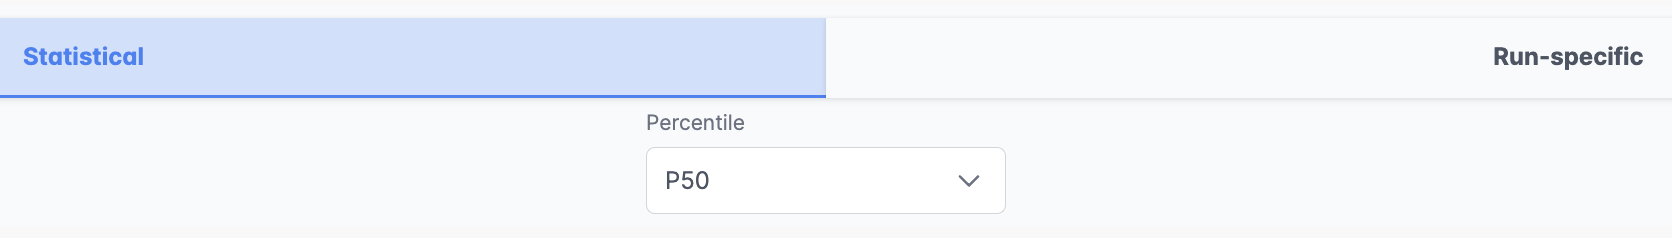
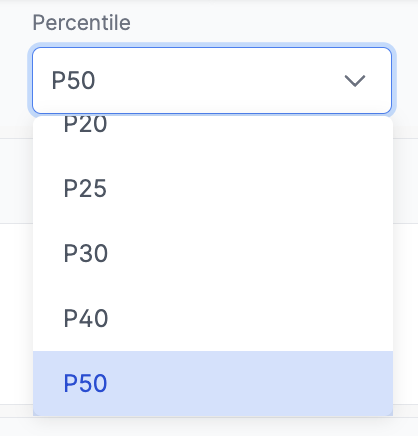
Select a p value
You can select a p value using the dropdown at the top of the page. All graphs on the page update to display data for that p value.
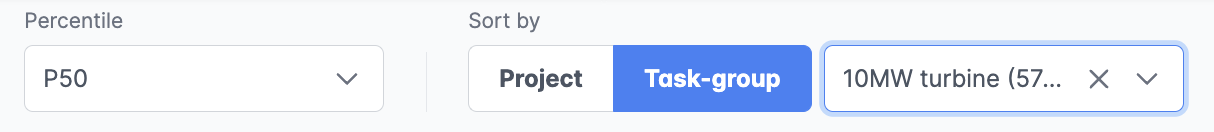
If you're on the Run-specific tab, you also need to select how the data is sorted. You can choose Project (i.e., Campaign duration) or Task-group (i.e., Task group duration). The p value you select is derived from the metric you select here.
Download reports and project plans
Use the buttons at the top of the page to download data in the required format.
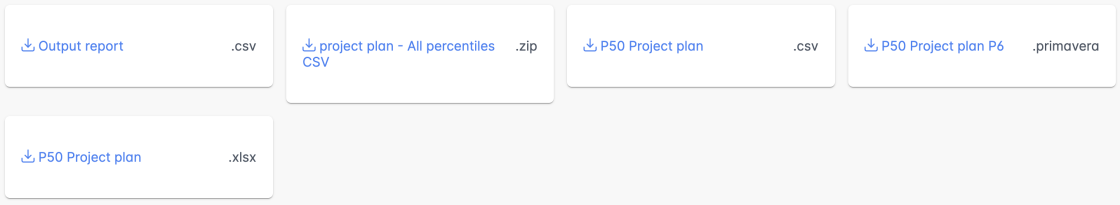
Learn more about downloading data and how to import project plans in MS Project and Primavera in our output guides.
Interact with a graph
Collapse and expand
You can collapse and expand a graph using the - and + buttons at the top right corner.
Zoom and pan
On each graph, you can zoom using the icons that appear at the bottom right when you hover over the graph. Reset the zoom using the reset icon in the centre.

Pan a graph by clicking, holding, and dragging.
Toggle display items
Use the graph legend to toggle which items are displayed on the graph. Switch display modes
Switch display modes
On some graphs, there is a radio button to switch between display modes.